Market Phases
Posted on 18. Sep, 2008 by Nicolai Kolding
In trying to decide how to respond to the Merrill Lynch, Lehman Brothers, and AIG debacles, I’ve concluded that the best answer is to remind all of us to focus locally, where real estate really matters. This isn’t to say that the news isn’t important but (a) this shall pass, and (b) I believe the men and women who are on the front lines each and every day are better served focusing on the forces that they have some control over.
The basic question that everyone is asking is, “Where is the market headed?” Any broker or agent who tries to answer that one had better know his or her market inside and out. And if you believe that real estate is cyclical, then understanding what phase of the cycle you’re in is critical.
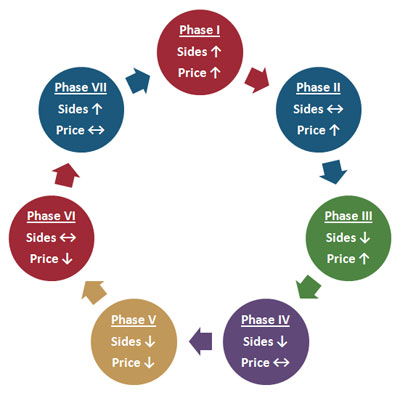
There are a number of different takes on this, but here is one version of the phases of a typical real estate cycle:
Note that sales price movement generally lags behind transaction sides. The first indication of a softening market is typically when sides slow while price continues to climb. Eventually, both price and sides are in decline (and, as we all know far too well, the transition from Phase III to V can be very rapid in some markets). Typically, the recovery is driven by transaction sides, not price. Although extraordinary factors can move a market “back” a phase, this flow is fairly typical.
Of course, the rate of change and the length of time in each phase is completely different from market to market and from cycle to cycle. The key to everyone in the industry is knowing where you are and, then, what to do and say.
Every agent and broker should know at all times which phase his or her local market is in. It takes no time at all to pull the basics needed: be sure you know your total market transactions and sales volume in monthly segments going back as far as you can. Define your market by carving the data as needed (in other words, if you’re serving only a certain price point or neighborhood, focus your study there). Plot it out in a table or graph it so you can better see what’s going on. Then study the current state of sides, sales price, and inventory versus prior periods to spot the trends and determine which phase you’re in.
Have a specific game plan for each phase as well as a communications plan to educate your customers. Be ready with the statistics and share them. Be the local market leader in distributing and deciphering these figures. With knowledge will come confidence and you may in fact help, in at least a small way, to shape the direction of the market.
Some time in the not-too-distant future, I will post another crossword (or something similar). If you’re the competitive type and want a free hint or two (including what date and time it will post), be sure to sign up on Twitter and follow the brand and me!
|


Mark Jeffers
18. Sep, 2008
Every builder worth his salt uses absorbsion rate to help determing these cycles and most real estate folks that value data will as well. AR doesn’t fully take into account the price piece of the puzzle, but I agree that cycles are largely driven by sides not price. Trouble is, the rank and file largely lost the desire to know these types of facts because it wasn’t necessary during the housing boom. I bet if you look around the office at who is still there, the majority of folks who have 15+ years experience are still around. We have been here before, but as with any growing industry, the larger you are, the more you feel the pain when things slow. Just ask the banks. Local small town conservative banks say that not much has changed in their world recently at least compared to the big guys. As the market for real estate and homeownership continues to grow, every correction will feel increasingly painful. I do recall making the statement about 2.5 years ago when someone told me the national rate of homeownership was near 71% that 1.) that couldn’t continue and 2.) that I heard a pretty intelligent economist say once that the economy was healthiest at about 65%.
Charles "Chuck" DelGrande
18. Sep, 2008
I think it’s time to call it a Phaser, not a Phase…that way we can look at the settings, see that it’s on “stun” and understand why we all feel the way we do…if you look closely at the sequence in these links, I believe the similarities to “being vaporized” with the Type II Phaser and what’s happened this year to Bear Sterns, Lehman, Fannie/Freddie, Merrill, AIG, etc. are eerily similar…
http://www.phasers.net/2260/p2-mm06.jpg
http://www.phasers.net/2260/p2-mm07.jpg
http://www.phasers.net/2260/p2-mm08.jpg
http://www.phasers.net/2260/p2-mm09.jpg
http://www.phasers.net/2260/p2-mm10.jpg
Nicolai Kolding
19. Sep, 2008
@Mark – Although there are plenty of great sales agents who study a vast array of numbers, I still think there’s room to borrow from other fields. You mention commercial real estate – if you haven’t already, I would encourage you to read Bob Albanese’s piece in this blog about absorption rates as I think you’ll enjoy it.
I would also take some metrics from retail (e.g., brokers should know what their revenues and profit per square foot of space is).
@Chuck – Good to hear from you! There are few people who know the numbers like you do. I’m glad you’ve chosen to take the nonsensical path to give us insight now (always a good choice)! You have a scary sense of humor, though I went to school with a lot of “Trekkies” who would love your take.
Mark Jeffers
19. Sep, 2008
Nicolai,
I thought the same thing right after I wrote the comment earlier so I did read Bob Albanese’s post and commented there too…that I should have read it before I commented here! I hate it when people are redundantly repetitive.
Market Phases: The Data Speaks | Better Homes and Gardens Real Estate
23. Sep, 2008
[...] few days ago I offered the idea that the direction of the residential real estate market is driven first by transaction sides then [...]
Analyzing NAR’s Monthly Release | Better Homes and Gardens Real Estate
25. Nov, 2008
[...] plan ahead. You may find some of what follows to be more valuable if you read our post on market cycles and if you have handy the one-page NAR data for October (found at the bottom of this article). [...]
December Analysis of NAR and FNMA Releases | Better Homes and Gardens Real Estate
23. Dec, 2008
[...] emotion completely out of this and focus on the facts. You may wish to read our earlier post on market cycles to get our views on what figures we spend the most time [...]
Review of February Releases from NAR, FNMA, and Case-Schiller | Better Homes and Gardens Real Estate
27. Feb, 2009
[...] than January ‘08). Although the trends are clearly not what the average homeowner wants, this is a necessary stage on the road to recovery and we should expect that the rate of price declines will soon decrease and [...]